If you are in a SaaS business, you know that the success of your business depends heavily on the engagement and retention of your users, and paying attention to this is of great importance. After all, it’s not just about acquiring customers, it’s about retaining them for the long term.
In this post, we will work in detail on SaaS retention metrics to measure customer engagement. We will also talk about how you can measure and optimise the engagement of your users. In addition, we will introduce the main tools you can use to define your active users and discuss what KPIs you should be looking at to get a complete understanding of your SaaS business performance.
If you’re ready to take your SaaS startup to the next level and maximise your user engagement and retention, read on!

What is meant by engagement in user retention?
We know that engagement in user retention is key to the success of your SaaS startup, but what does it really mean?
Imagine you have an app or platform full of amazing features and solutions to your users’ problems. Activation is the first step, when users sign up and start exploring your product. But that’s not the end of the story.
Engagement is the next essential component of user retention. It’s about how much and how often your users interact with your product. It’s about having a strong, ongoing relationship with your customers, where they are committed to using your product on a daily basis.
But how can we measure this engagement? This is where KPIs or key performance indicators come into play – don’t worry, they’re not as complicated as they sound! They are metrics that help you understand and evaluate your users’ activity and that will be of great help to us.
Let’s take a look at some common engagement KPIs that you can use in your SaaS startup:
- MAU, WAU, DAU: These acronyms stand for Monthly Active Users (MAU), Weekly Active Users (WAU) and Daily Active Users (DAU). They are metrics that give you an idea of how many people are actually using your product in different time periods.
- DAU/MAU Ratio: This ratio compares Daily Active Users to Monthly Active Users. It helps you understand what percentage of your users are consistently engaged.
- Retention on different days: Here, you can evaluate the retention of users on day 0 (when they sign up), day 1+, day 7+ and day 28. This shows you how many users are still using your product after a certain number of days.
- Number of returning users: This metric tells you how many users come back and use your product on a recurring basis. It is a good indicator of engagement.
- Other engagement metrics: Total time viewed, total time spent, frequency of visits, pages per session/visit, scroll depth, average session/visit duration, exit rate/exit page and product abandonment rate. These metrics help you understand how users interact and engage with your product.
The DAU or MAU is one of the most important engagement KPIs. Measuring the total number of active users may seem straightforward at first, but we encounter some challenges. Analysts often face two key questions: What is considered “active” and how often should we report the KPIs DAU, WAU, MAU? In the following paragraphs, we will discuss each challenge.
Active users: How to define them and which events to use
Defining what it means to be “active” can be a real challenge. There are different actions you can use to define active users on your platform to keep better track of them. Here are some of the most common ones:
- Visit: This event counts every time a user visits your website. However, be aware that it may be too broad and overestimate the number of users, as it may include those who are not authenticated or not registered. Also, this metric is only relevant for companies with a web presence.
- Login: Here, every time a user logs into your platform, it is recorded as an activity event. However, be careful, as it may count more users than necessary, including those who are not authenticated.
- Application login/open: Similar to login, this event is logged every time a user opens your application. But again, be sure to exclude new users with their first application open event, as well as unauthenticated and duplicate users.
- Web page views/screen views: Every time a user views a web page or screen on your platform is considered an activity event. Note that this metric can include all types of users, such as inactive, stragglers and new users, which can result in an overestimation of active users.
- Primary user activity: This event refers to the key action you expect your users to take on your platform, such as viewing items, performing searches, logging exercises or making transactions. Note, however, that this metric may miss active users who do not perform the main activity you expect, but still use your application.
As an analyst, you need to keep in mind that the definition of activity you stick with (be it login or app opening) must be consistent across all devices and platforms, as well as across the multiple data sources you use for analysis.
In my experience, the event that works best for me is the main user activity. I ignore “noisy” events such as visits or screen views and logins, and focus on the main event that I expect users to perform most frequently. This gives me a clearer view of the really active users whose behaviour I can monitor and validate. In addition, event tends to be available across platforms and data sources, making it easier to track and measure.

DAU, MAU or WAU?
The most common question from analysts and PMs is: which engagement KPI is the best to use for weekly/monthly reporting? DAU, WAU or MAU? What is the most reliable way to know the correct and appropriate frequency of user usage of the product? The answer lies in your product vision and the data you have at hand.
Let’s start with the product vision. Think about how you expect your users to use your product – do you expect them to use it once a week, daily or even hourly? How often would you like users to perform a specific action, such as logging an exercise or sending a message? The frequency of use may vary depending on the type of product you offer.
Social media companies typically monitor Active Users by the Hour or even by the Minute. If your product falls into the category of social networking, search or browsers, you would most likely expect your users to use it at least once a day, if not hourly. However, if your product is a website, you may focus on a weekly or monthly frequency, which is also common for travel, dating or payment apps.
Improve Saas customer retention
Now, it’s time to quantify it. You can run an activity histogram analysis to get a better understanding of the current usage of your product. Examine the number of Active Hourly Users (HAU) and assess whether that number makes sense to scale. Also check the total number of daily sessions or logins per user. If the number is high, that may be your ideal engagement metric.

In addition, it is useful to extract the DAU/WAU and DAU/MAU ratio metrics. These will show you the percentage of Monthly or Weekly Active Users who use your product on a daily basis. The higher the ratio, the more frequent the user activity.
Visualisation of user retention metrics
If you still don’t know which KPI to stick with, here is a simple guide to help you:
- If the DAU/WAU ratio is 60% or higher, it means that users use the product more than 4 days per week. In this case, you should follow reports based on DAU instead of WAU.
- If the WAU/MAU ratio is 60% or higher, it means that users use the product more than 2 or 3 times a month. In this case, it is more relevant to follow reports based on the WAU instead of the MAU.
These analyses will help you get a clearer picture of SaaS retention metrics to measure customer engagement and frequency of use of your product and the most appropriate metrics to track. Remember to tailor your reports to the vision and goals of your SaaS startup.
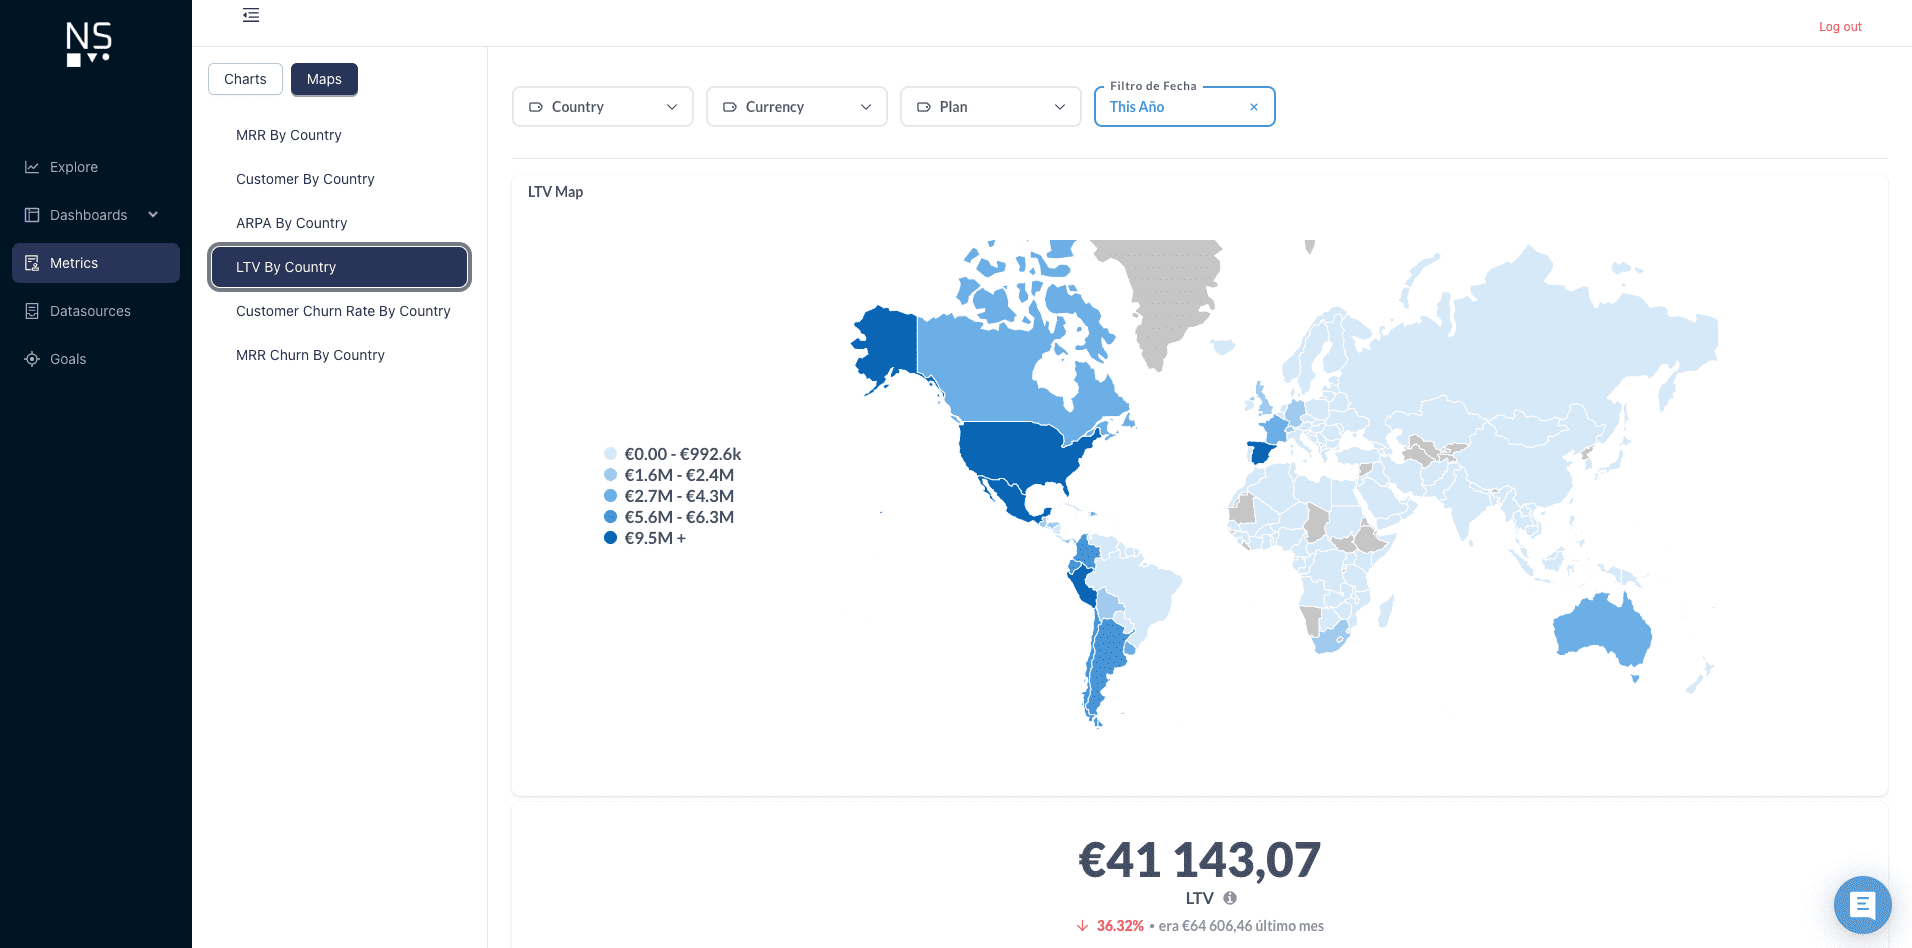
As a Startup specialised in SaaS business KPI visualisation analysis we can help you with this process and you will be able to have Dashboards like this one with the most important metrics of your business.