Connect all your data in one place, build dashboards, automate reports and forecast in minutes. Calculate cohorts metrics by customer type and predict your churn
A SaaS Analytics Dashboard offers real-time data access, customization, and cost-efficiency. Its user-friendly interface promotes data literacy, and collaboration features enhance teamwork. With data security and advanced predictive analytics, it empowers businesses to make informed decisions, allocate resources efficiently, and stay ahead in today's competitive landscape.
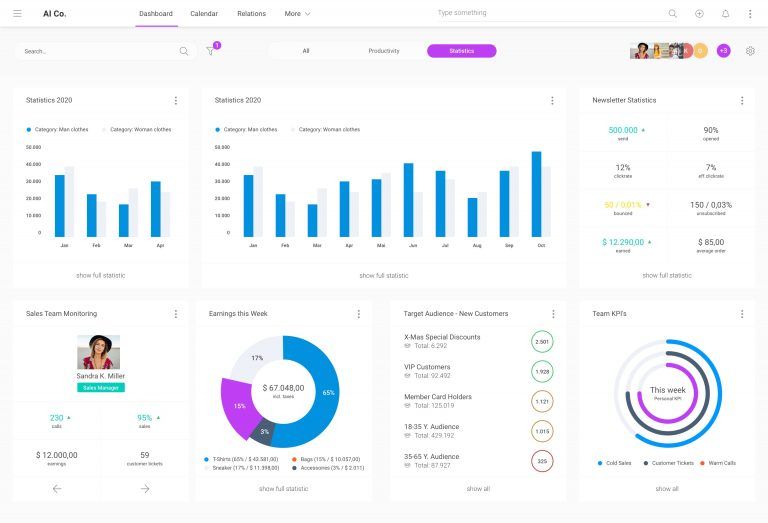
Change your business using a dashboard
Your data is fragmented in different platforms and databases
Excel, analytics, hubspot, stripe...you need to acces to each platform report
You waste timebuilding reports and kpi´s in excel
with unreliable data and broken formulas
Many business questions don’t have data based answers
Churn or CAC in Europe, for Enterprise Plan customers cannot be the same as in Philadelphia. Analyze what is happening in each customer segment
Try Our Finnancial Dashboard Demo for SaaS and Retail
How we do
How to use our Dashboard Software
Are you tired of spending countless hours generating reports, unifying data, and correcting errors? If you’re a CFO or financial team member, it’s time to consider a financial reporting software and dashboards that can help streamline your processes.
1. Connect your Data
Provide us a list of your customer transactions, contracts or invoices, through CSV, Stripe, Paypal, Holded or your billing system... and we will automate the calculation of kpi's and reporting.
Visualize your data in powerful dashboards and customize and automate reports for investors, team and others. Generate reports and alerts on compliance with the defined targets and keep your entire team aligned.
Some metrics and features included in our analytics dashboard
Experience the power of data first-hand. Obtain the metrics or KPI's of your business to prepare reports and make future decisions.
New Customers
Evaluate how many new users are entering your business
Upsell MRR
Represents the additional monthly revenue generated by upselling or upgrading existing customers to higher-tier plans, adding new features, or increasing the quantity or scope of their subscriptions
Lost Customers
Are you losing income? Identify if you have lost your customer quota
Downsell MRR
Calculate the drop in your monthly income at a glance and in a simple way
Churn Mrr
At a glance compare your monthly profits and losses from subscribing to your services
MRR / ARR
A method to calculate the TOTAL amount of your subscription incomeand recurring revenue that a business expects to receive per month and per year
CAC
it is a crucial metric used by businesses to measure the cost associated with acquiring a new customer.
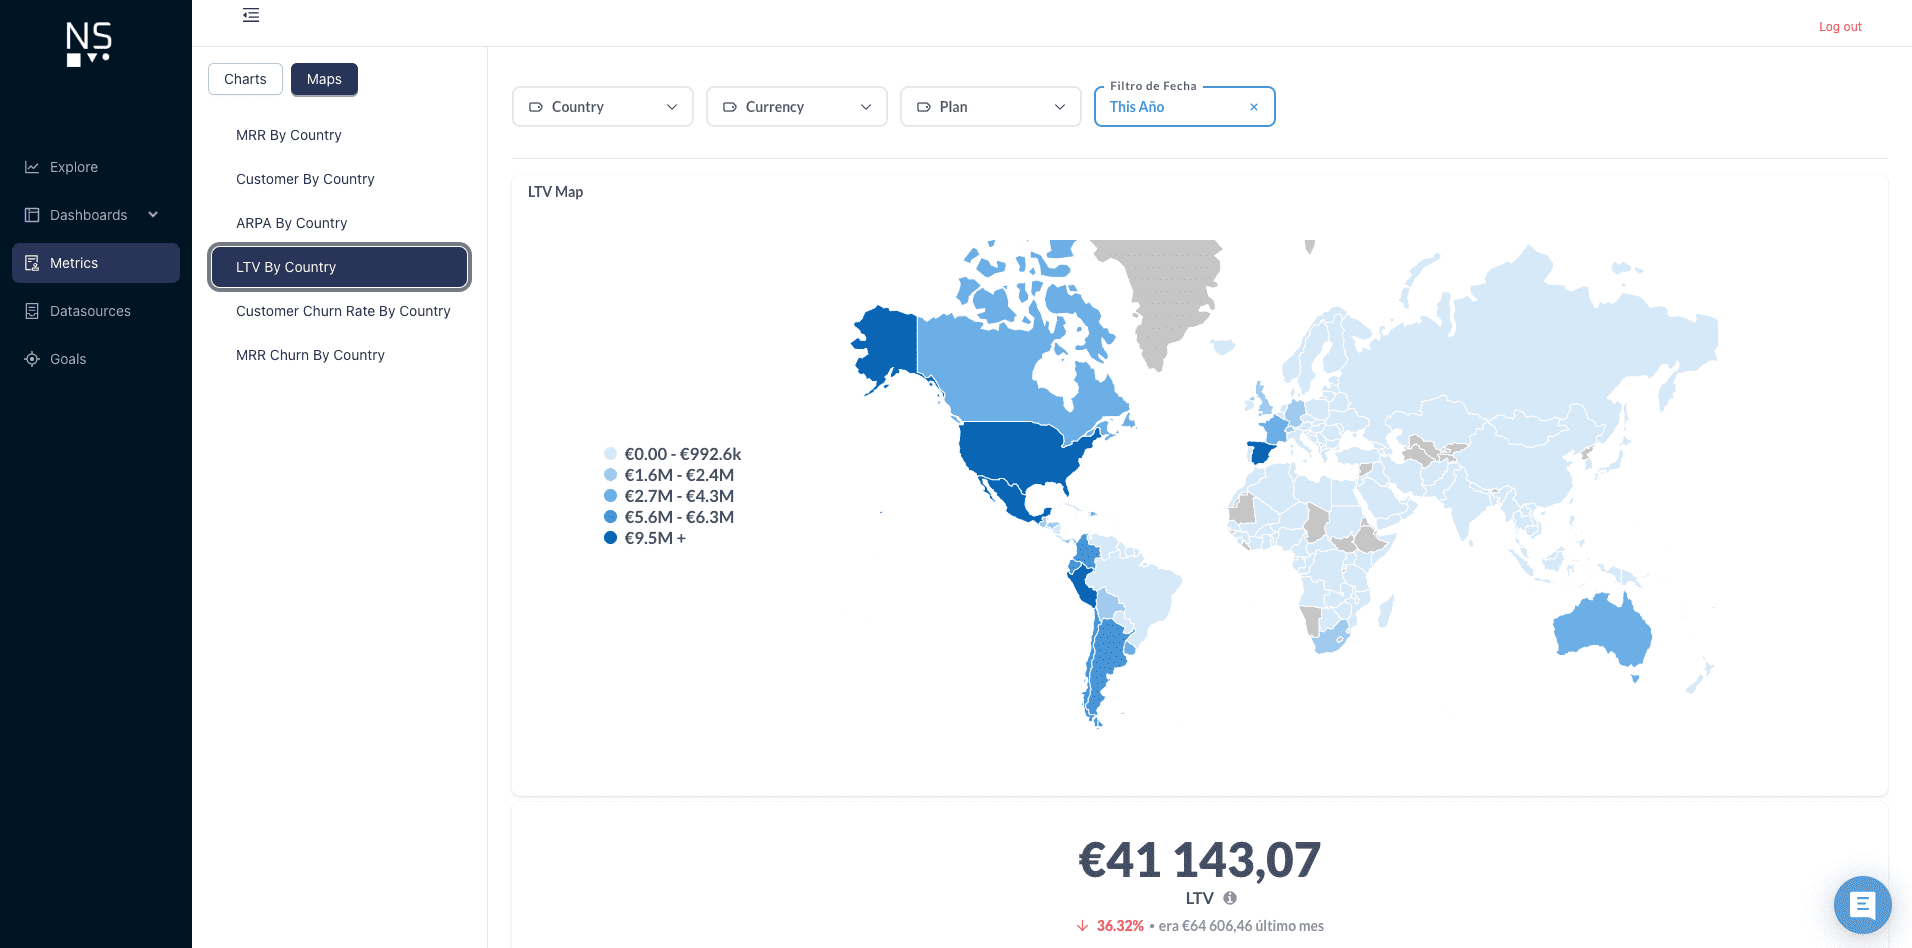
LTV
Estimate the total revenue a customer is expected to generate over the entire duration of their relationship with the company
Segmentation
Discover Where You Lose or Gain More Customers: The Powerful Cohorts and Segmentation Analytics in Your SaaS
Extracting individual metrics is straightforward. The real power of the tool lies in doing it by cohorts and segmentations to derive predictive insights about the business's evolution.